Matplotlib
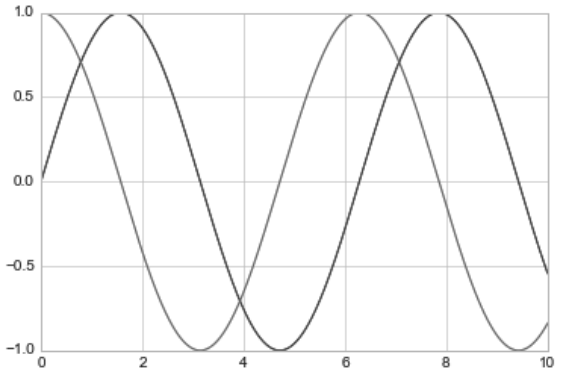
import matplotlib
1 | import matplotlib.pyplot as plt |
style
1 | plt.figure() # 创建图形 |
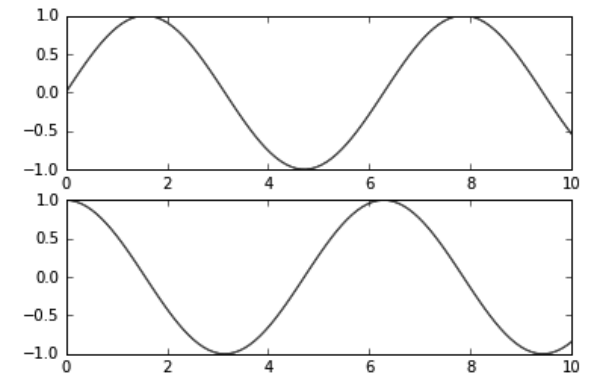
1 | %matplotlib inline |
1 | fig = plt.figure() |
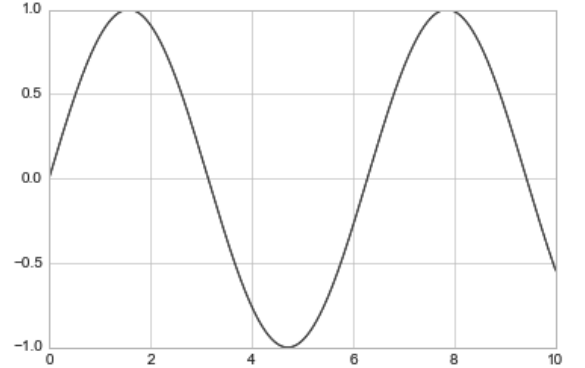
1 | plt.plot(x, np.sin(x)) |
1 | plt.plot(x, np.sin(x - 0), color='blue') # 标准颜色名称 |
styles of curve
1 | plt.plot(x, x + 0, linestyle='solid') |
limit the size
1 | plt.plot(x, np.sin(x)) |
cut the blanket area
1 | plt.axis('tight'); |
make the x-axis and y-aix to be 1 to 1
1 | plt.plot(x, np.sin(x)) |
label
1 | plt.plot(x, np.sin(x)) |
scatter diagram
1 | %matplotlib inline |
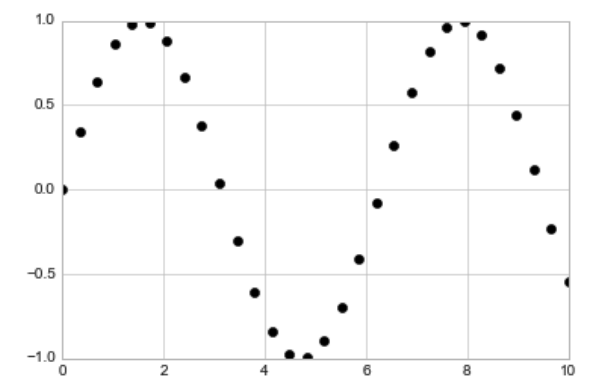
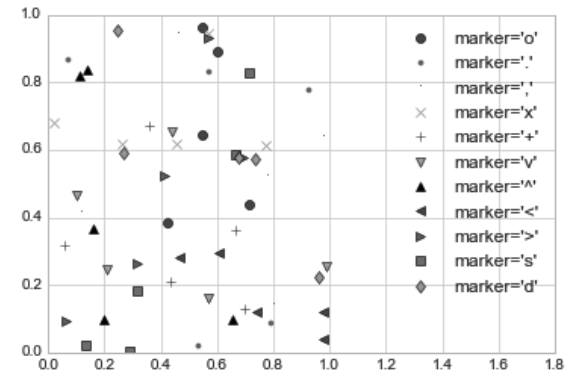
different values can be represented by different symbol:
1 | rng = np.random.RandomState(0) |
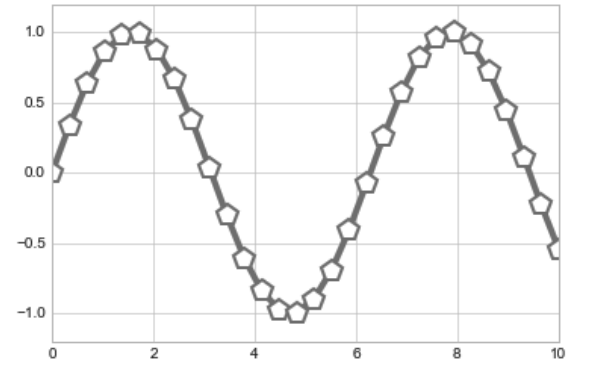
other function
1 | plt.plot(x, y, '-p', color='gray', #"-" represented the curve |
another way:scatter
1 | plt.scatter(x, y, marker='o') |
whent the random points have different size
1 | rng = np.random.RandomState(0) |
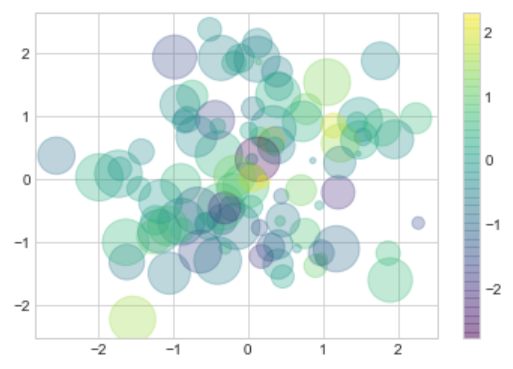
plt.scatter will spend more on make the picture more beautiful and accurate,so it costs more resource
errrorbar
1 | x = np.linspace(0, 10, 50) |
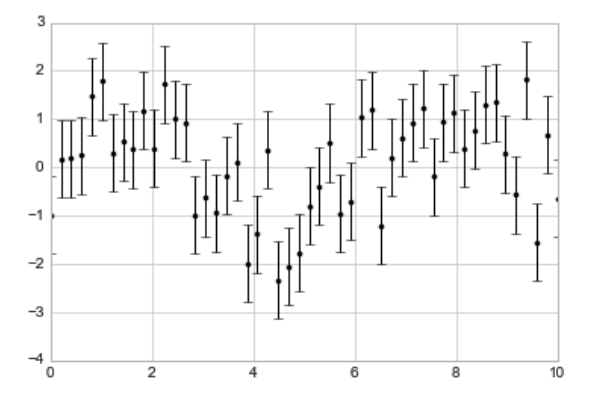
different style:
1 | plt.errorbar(x, y, yerr=dy, fmt='o', color='black', ecolor='lightgray', elinewidth=3, capsize=0) |
Continuous error
fill_between
1 | plt.plot(xdata, ydata, 'or') |
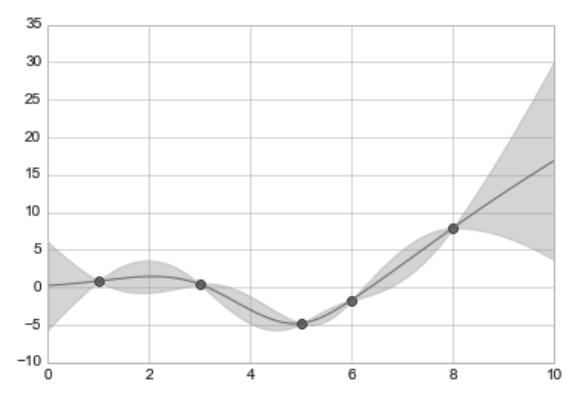
histogram
1 | data = np.random.randn(1000) |
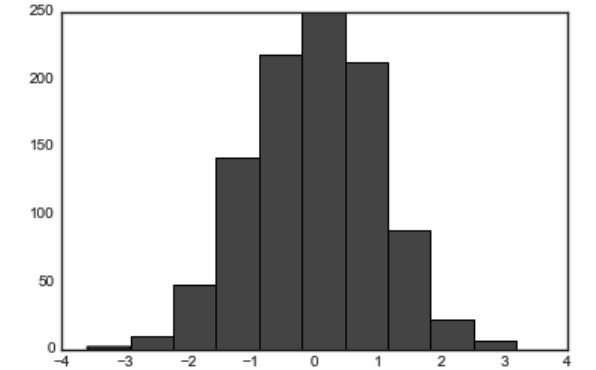
other factors:
1 | plt.hist(data, bins=30, normed=True, alpha=0.5, #alpha descides the level of transparence |
multivariate Gaussian distribution
1 | mean = [0, 0] |
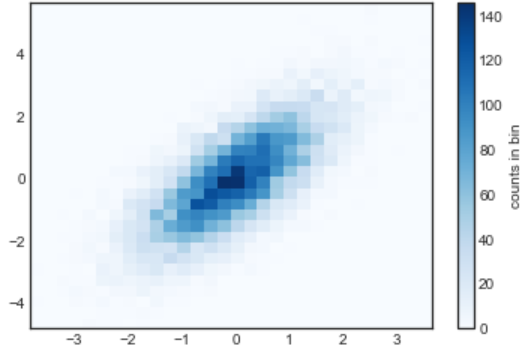
1 | plt.hexbin(x, y, gridsize=30, cmap='Blues') #change the squres to hexagon |
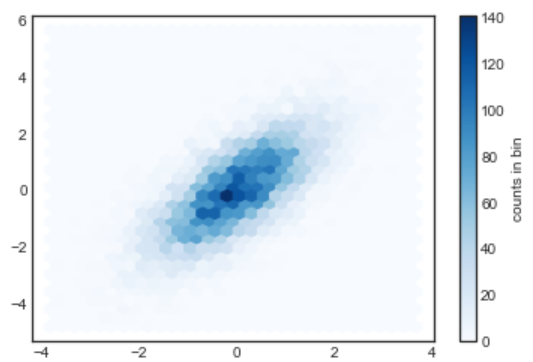
configuration
1 | import matplotlib.pyplot as plt |
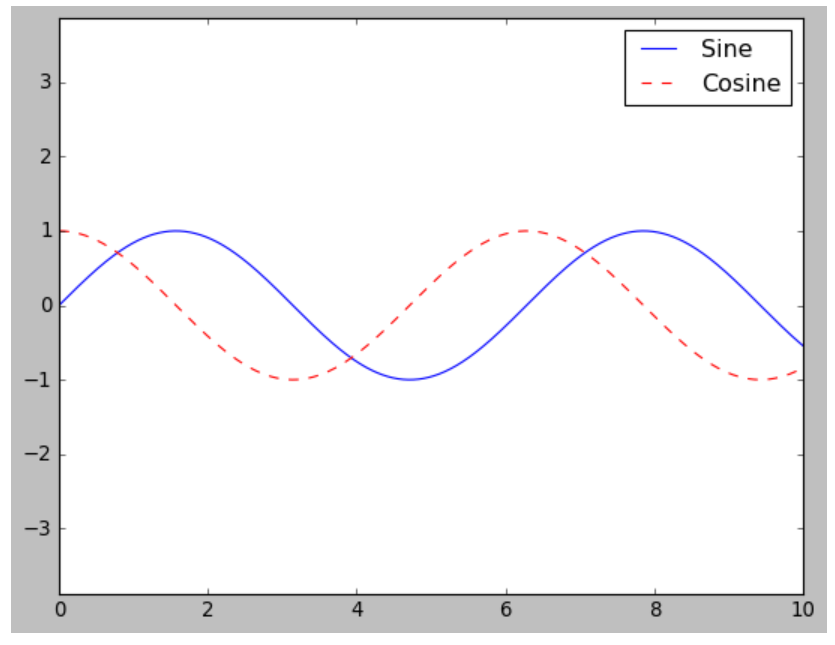
1 | ax.legend(frameon=False, loc='lower center', ncol=2) #frameon controls the transparence of the box of label,loc controls the location,ncol control the number of columns |
