pandas4

Pandas Introduction 4

accumulation

count() 计数项
first()、last() 第一项与最后一项
mean()、median() 均值与中位数
min()、max() 最小值与最大值
std()、var() 标准差与方差
mad() 均值绝对偏差(mean absolute deviation)
prod() 所有项乘积
sum() 所有项求和
describe() 分析数据的所有特征(如最大值)
dropna() 丢失有缺失值的行

GroupBy

分割,应用,组合

separate,accumulate,combine
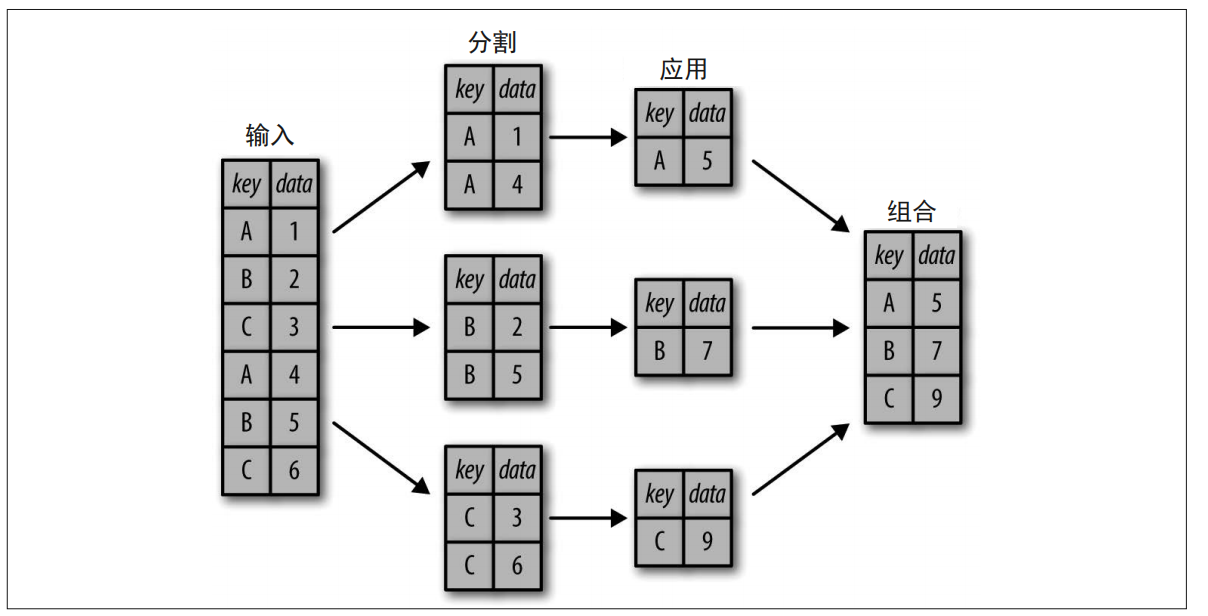
aa7xxg.png

中间过程不需要被看见

1
2
3
4
5
6
7
8
9
10
11
12
13
14
15
16
17
18
19
20
21
22
23
24
df = pd.DataFrame({'key': ['A', 'B', 'C', 'A', 'B', 'C'], 'data': range(6)}, columns=['key', 'data']) 
df
'''
Out: key data
0 A 0
1 B 1
2 C 2
3 A 3
4 B 4
5 C 5
'''

df.groupby('key')
#Out: <pandas.core.groupby.DataFrameGroupBy object at 0x117272160> #对象被生成了,其各种运算也被记入

#result:
df.groupby('key').sum()
'''
Out: data
key
A 3
B 5
C 7
'''

行星案例:

1
2
3
4
5
6
7
8
9
10
11
12
13
14
15
16
17
18
19
20
21
22
23
24
25
26
27
28
29
30
31
32
33
34
35
36
37
38
39
40
41
42
43
44
45
46
47
48
49
50
51
52
53
54
55
56
57
58
59
60
61
62
63
64
65
66
import seaborn as sns 
planets = pd.read_csv('planets.csv') #read the csv
planets.groupby('method') #use groupby
#out:<pandas.core.groupby.generic.DataFrameGroupBy object at 0x000002AACB4399C8>

planets.groupby('method')['orbital_period']#only talk about one column
#out:<pandas.core.groupby.generic.SeriesGroupBy object at 0x000002AACEE3BF48>

planets.groupby('method')['orbital_period'].median()#accumulation
'''
method
Astrometry 631.180000
Eclipse Timing Variations 4343.500000
Imaging 27500.000000
Microlensing 3300.000000
Orbital Brightness Modulation 0.342887
Pulsar Timing 66.541900
Pulsation Timing Variations 1170.000000
Radial Velocity 360.200000
Transit 5.714932
Transit Timing Variations 57.011000
Name: orbital_period, dtype: float64
'''

for (method, group) in planets.groupby('method'):
print("{0:30s} shape={1}".format(method, group.shape))#{}表示将后面的变量放入其中,0:30指取0~30的字符
'''
Astrometry shape=(2, 6)
Eclipse Timing Variations shape=(9, 6)
Imaging shape=(38, 6)
Microlensing shape=(23, 6)
Orbital Brightness Modulation shape=(3, 6)
Pulsar Timing shape=(5, 6)
Pulsation Timing Variations shape=(1, 6)
Radial Velocity shape=(553, 6)
Transit shape=(397, 6)
Transit Timing Variations shape=(4, 6)
'''

planets.groupby('method')['year'].describe().unstack()
'''
count mean std min 25% \\
method
Astrometry 2.0 2011.500000 2.121320 2010.0 2010.75
Eclipse Timing Variations 9.0 2010.000000 1.414214 2008.0 2009.00
Imaging 38.0 2009.131579 2.781901 2004.0 2008.00
Microlensing 23.0 2009.782609 2.859697 2004.0 2008.00
Orbital Brightness Modulation 3.0 2011.666667 1.154701 2011.0 2011.00
Pulsar Timing 5.0 1998.400000 8.384510 1992.0 1992.00
Pulsation Timing Variations 1.0 2007.000000 NaN 2007.0 2007.00
Radial Velocity 553.0 2007.518987 4.249052 1989.0 2005.00
Transit 397.0 2011.236776 2.077867 2002.0 2010.00
Transit Timing Variations 4.0 2012.500000 1.290994 2011.0 2011.75
50% 75% max
method
Astrometry 2011.5 2012.25 2013.0
Eclipse Timing Variations 2010.0 2011.00 2012.0
Imaging 2009.0 2011.00 2013.0
Microlensing 2010.0 2012.00 2013.0
Orbital Brightness Modulation 2011.0 2012.00 2013.0
Pulsar Timing 1994.0 2003.00 2011.0
Pulsation Timing Variations 2007.0 2007.00 2007.0
Radial Velocity 2009.0 2011.00 2014.0
Transit 2012.0 2013.00 2014.0
Transit Timing Variations 2012.5 2013.25 2014.0
'''

累计、过滤、转换和应用

aggregate()、filter()、transform() 和 apply()

1
2
3
4
5
6
7
8
9
10
11
12
13
14
15
16
17
18
19
20
21
22
23
24
25
26
27
28
29
30
31
32
33
34
35
36
37
38
39
40
41
42
43
44
45
46
47
48
49
50
51
52
53
54
55
56
57
58
59
60
61
62
63
64
65
66
67
68
69
70
71
72
73
74
75
76
77
78
79
80
81
82
83
84
85
86
87
88
89
90
91
92
93
94
95
96
97
98
rng = np.random.RandomState(0) 
df = pd.DataFrame({'key': ['A', 'B', 'C', 'A', 'B', 'C'],
'data1': range(6),
'data2': rng.randint(0, 10, 6)},
columns = ['key', 'data1', 'data2'])
df
'''
key data1 data2
0 A 0 5
1 B 1 0
2 C 2 3
3 A 3 3
4 B 4 7
5 C 5 9
'''


#累计
df.groupby('key').aggregate(['min', np.median, max])
'''
Out:
data1 data2
min median max min median max
key
A 0 1.5 3 3 4.0 5
B 1 2.5 4 0 3.5 7
C 2 3.5 5 3 6.0 9
'''

df.groupby('key').aggregate({'data1': 'min', 'data2': 'max'})
'''
data1 data2
key
A 0 5
B 1 7
C 2 9
'''


#过滤
def filter_func(x):
return x['data2'].std() > 4
print(df); print(df.groupby('key').std());
print(df.groupby('key').filter(filter_func))
'''
key data1 data2
0 A 0 5
1 B 1 0
2 C 2 3
3 A 3 3
4 B 4 7
5 C 5 9
data1 data2
key
A 2.12132 1.414214
B 2.12132 4.949747
C 2.12132 4.242641
key data1 data2
1 B 1 0
2 C 2 3
4 B 4 7
5 C 5 9
'''

#转换 #it will change the original data
df.groupby('key').transform(lambda x: x - x.mean())#the difference between the original one and the mean
''' #lambda 为匿名函数,较其他函数更加简洁,作用同其他函数
data1 data2 #这里的mean指每个data中的每个组(ABC)的均值
0 -1.5 1.0
1 -1.5 -3.5
2 -1.5 -3.0
3 1.5 -1.0
4 1.5 3.5
5 1.5 3.0
'''

#apply()
def norm_by_data2(x):
# x是一个分组数据的DataFrame
x['data1'] /= x['data2'].sum()
return x
print(df); print(df.groupby('key').apply(norm_by_data2))
'''
key data1 data2
0 A 0 5
1 B 1 0
2 C 2 3
3 A 3 3
4 B 4 7
5 C 5 9
key data1 data2
0 A 0.000000 5
1 B 0.142857 0
2 C 0.166667 3
3 A 0.375000 3
4 B 0.571429 7
5 C 0.416667 9
'''

可自定义的键:

1
2
3
4
5
6
7
8
9
10
11
12
13
14
15
16
17
18
19
20
21
22
23
24
25
26
27
28
29
30
31
32
33
34
35
36
37
38
39
40
41
42
43
44
45
46
47
48
49
50
51
52
53
54
55
56
57
L = [0, 1, 0, 1, 2, 0] 
print(df); print(df.groupby(L).sum())
'''
key data1 data2
0 A 0 5 #0
1 B 1 0 #1
2 C 2 3 #0
3 A 3 3 #1
4 B 4 7 #2
5 C 5 9 #0
data1 data2
0 7 17
1 4 3
2 4 7
'''

#映射
df2 = df.set_index('key')
mapping = {'A': 'vowel', 'B': 'consonant', 'C': 'consonant'}
print(df2); print(df2.groupby(mapping).sum())
'''
data1 data2
key
A 0 5
B 1 0
C 2 3
A 3 3
B 4 7
C 5 9
data1 data2
consonant 12 19
vowel 3 8
'''

print(df2); print(df2.groupby(str.lower).mean())
'''
data1 data2
key
A 0 5
B 1 0
C 2 3
A 3 3
B 4 7
C 5 9
data1 data2
a 1.5 4.0
b 2.5 3.5
c 3.5 6.0
'''

df2.groupby([str.lower, mapping]).mean()
'''
data1 data2
a vowel 1.5 4.0
b consonant 2.5 3.5
c consonant 3.5 6.0
'''

数据透析表

pivot_table

1
titanic.groupby(['sex','class'])['survived'].aggregate('mean').unstack()

can be replaced by:

1
titanic.pivot_table('survived',index='sex',columns='class')

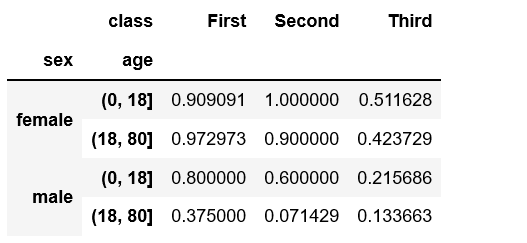
we can use cut and qcut to separate the table

cut can be used to add one more index

1
2
age=pd.cut(titanic['age'],[0,18,80])
titanic.pivot_table('survived',['sex',age],'class')

a5fCDA.png

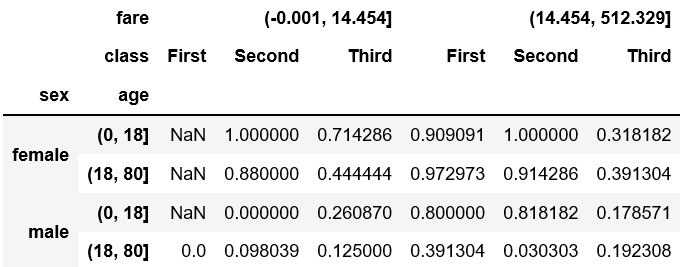
qcut can be used to add one more table

1
2
fare=pd.qcut(titanic['fare'],2)
titanic.pivot_table('survived',['sex',age],[fare,'class'])

a5hpGT.png

full pivot_table tags:

1
2
3
DataFrame.pivot_table(data, values=None, index=None, columns=None, 
aggfunc='mean', fill_value=None, margins=False, #margins 为计算总数
dropna=True, margins_name='All')